Preface
Introduction to R
What is R?
R is a powerful statistical environment and programming language for the analysis and visualization of data.
Why using R?
There are plenty of advantages of using R instead of other software packages…
Complete statistical environment and programming language
R integrates with other tools to generate manuscripts from your code. If you collect more data, or fix a mistake in your dataset, the figures and the statistical tests in your manuscript are updated automatically. R code is great for reproducibility. Reproducibility is when someone else (including your future self) can obtain the same results from the same dataset when using the same analysis.Efficient functions and data structures for data analysis
R is designed for data analysis. It comes with special data structures and data types that make handling of missing data and statistical factors convenient. R can connect to spreadsheets, databases, and many other data formats, on your computer or on the web. The skills you learn with R scale easily with the size of your dataset. Whether your dataset has hundreds or millions of lines, it won’t make much difference to you.Powerful graphics
The plotting functionalities in R are endless, and allow you to adjust any aspect of your graph to convey most effectively the message from your data.Access to fast growing number of analysis packages
With 10,000+ packages that can be installed to extend its capabilities, R provides a framework that allows you to combine statistical approaches from many scientific disciplines to best suit the analytical framework you need to analyze your data. For instance, R has packages for image analysis, GIS, time series, population genetics, and a lot more. R has a large and welcoming community. Thousands of people use R daily. Many of them are willing to help you through mailing lists and websites such as Stack Overflow, or on the RStudio community.Technical advantages: free, open-source, available for all OSs
Anyone can inspect the source code to see how R works. Because of this transparency, there is less chance for mistakes, and if you (or someone else) find some, you can report and fix bugs.
It’s easy to get distracted by Tableau and PowerBI’s visuals, but when it comes to making business decisions, your organization needs to be able to take actions. This is where R is lightyears ahead of the other tools.
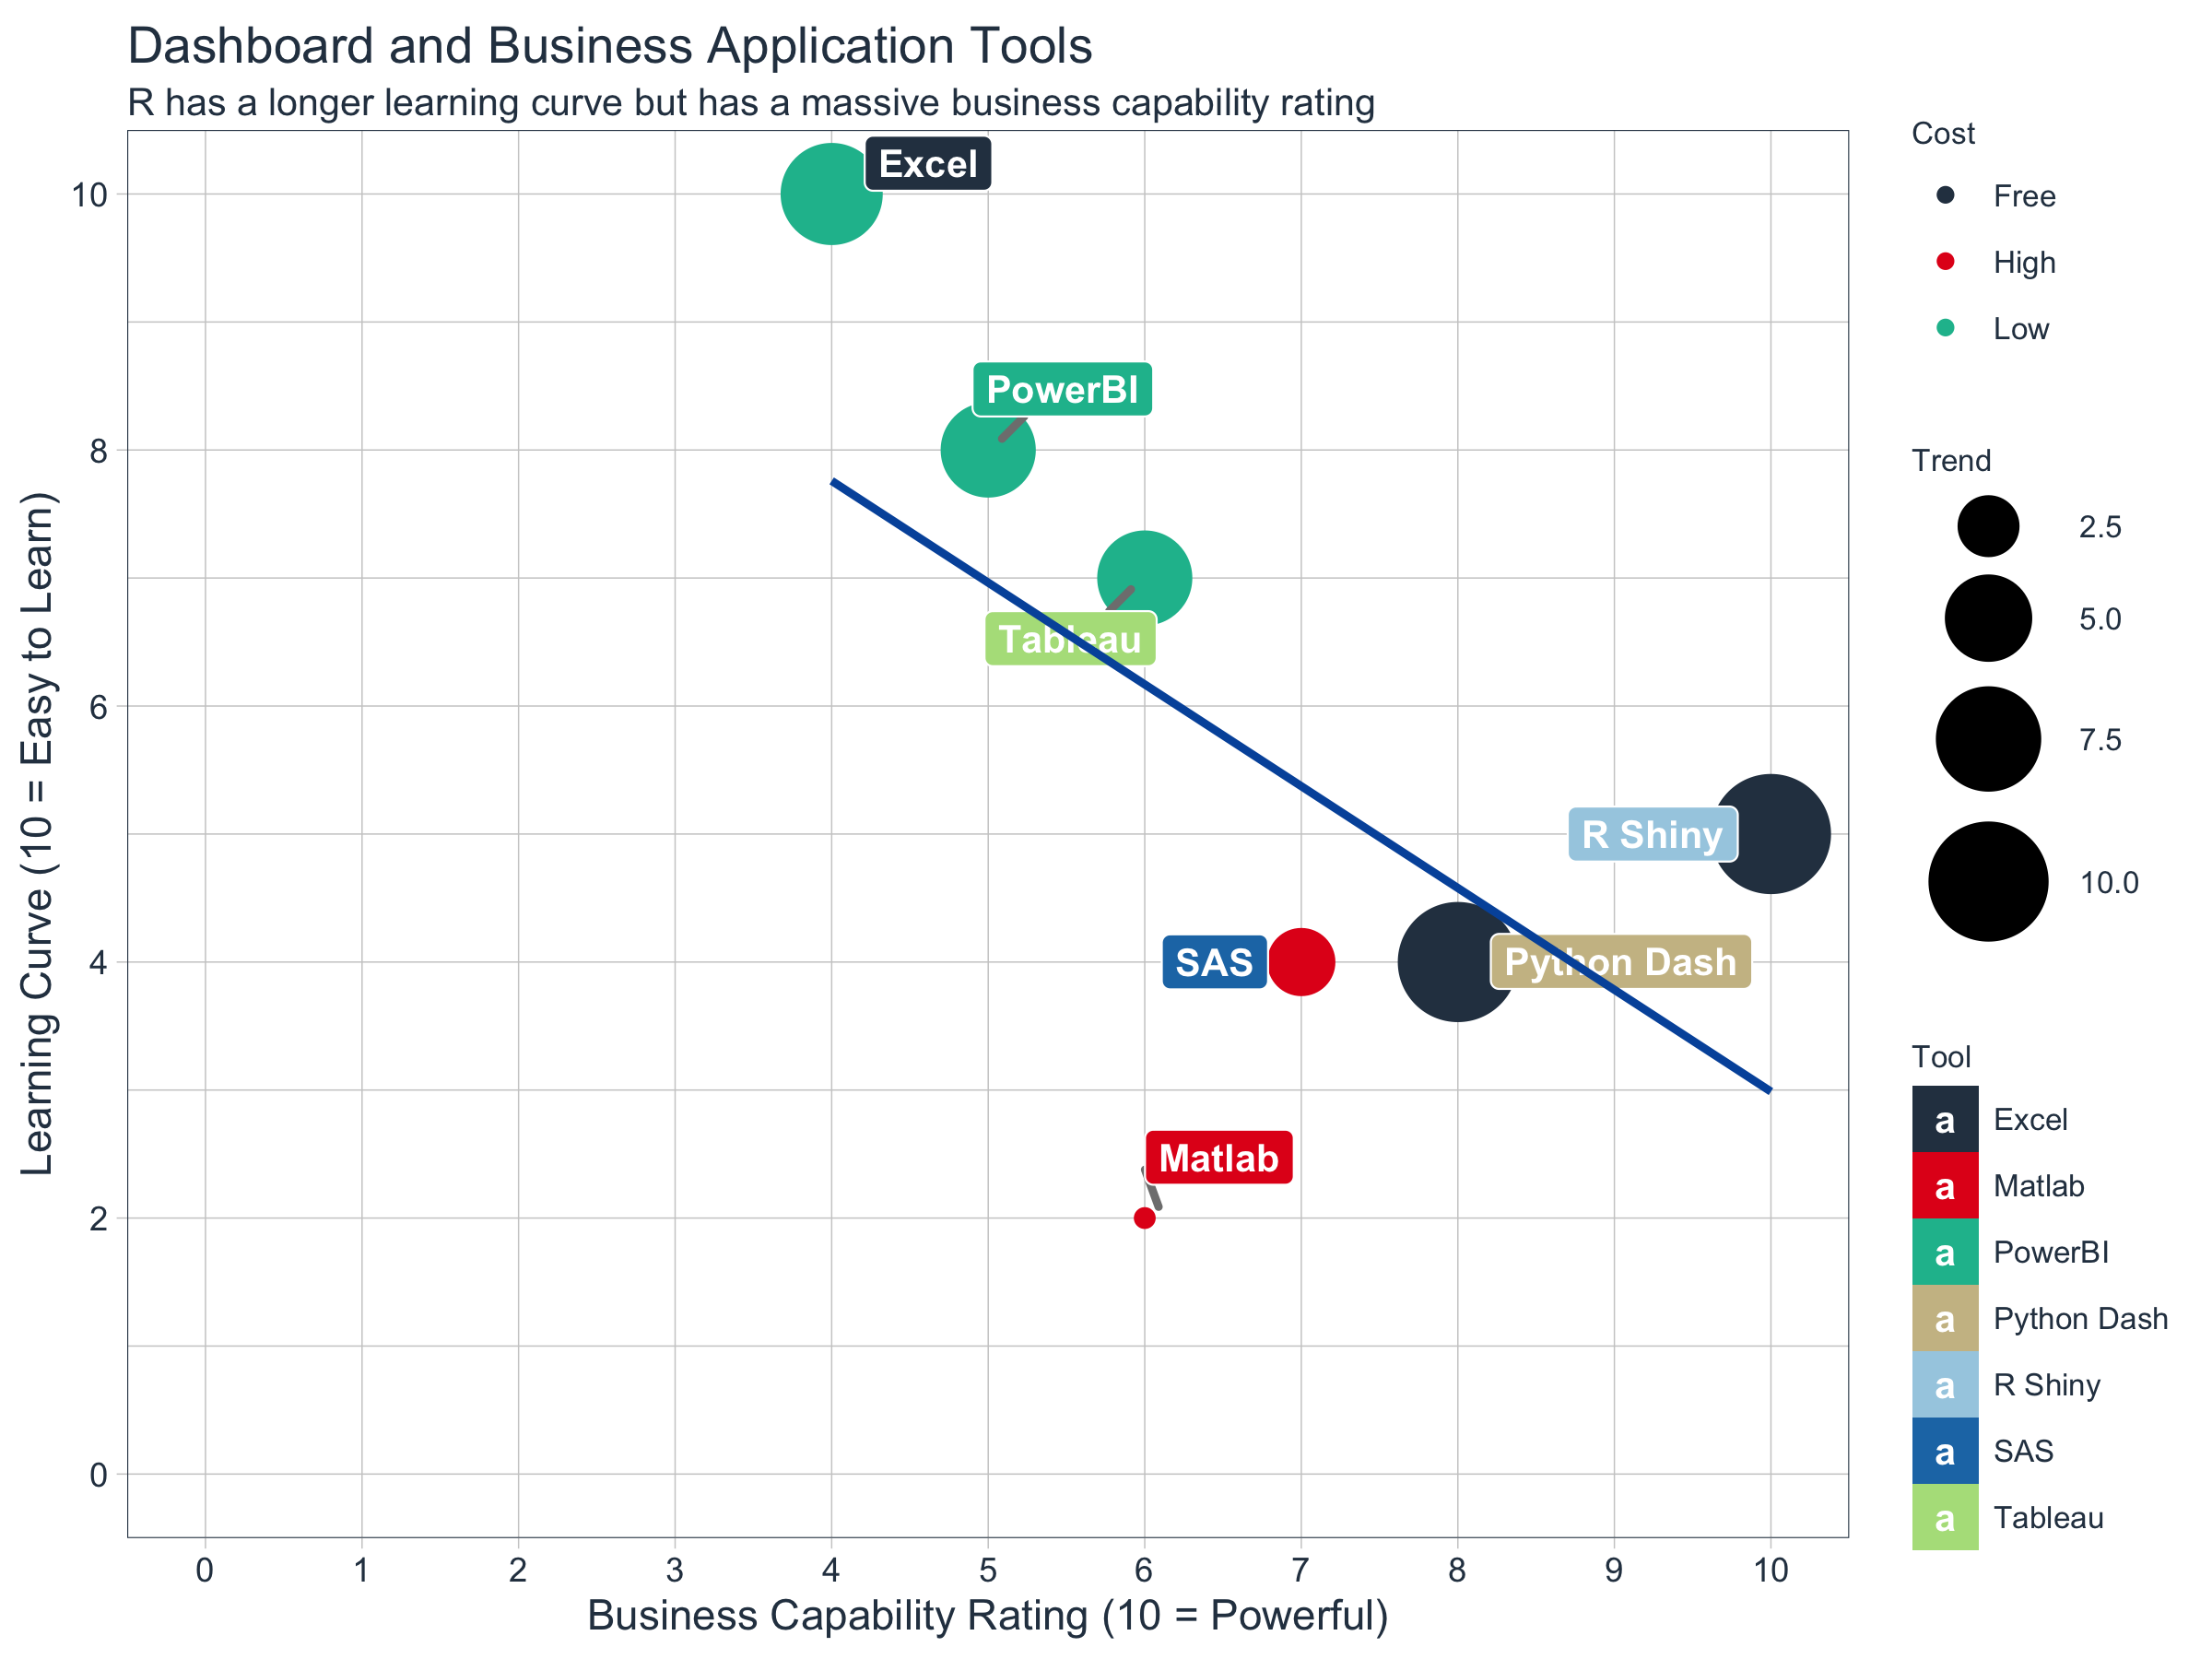
Tools like Excel and tableau are easier to learn, but have a lower Business Capability. R does not involve lots of pointing and clicking, and that’s a good thing. The learning curve might be steeper than with other software, but with R, the results of your analysis do not rely on remembering a succession of pointing and clicking, but instead on a series of written commands. So, if you want to redo your analysis because you collected more data, you don’t have to remember which button you clicked in which order to obtain your results; you just have to run your script again. Working with scripts makes the steps you used in your analysis clear, and the code you write can be inspected by someone else who can give you feedback and spot mistakes. Working with scripts forces you to have a deeper understanding of what you are doing, and facilitates your learning and comprehension of the methods you use.
Basically, learning to program should be on every data scientist’s to-do list. Knowing how to program will make you a more flexible analyst and augment your mastery of data science in every way. A good metaphor for describing this was introduced by Greg Snow on the R help mailing list in May 2006. Using functions in R is like riding a bus. Writing functions in R is like driving a car.
Busses are very easy to use, you just need to know which bus to get on, where to get on, and where to get off (and you need to pay your fare). Cars, on the other hand, require much more work: you need to have some type of map or directions (even if the map is in your head), you need to put gas in every now and then, you need to know the rules of the road (have some type of drivers license). The big advantage of the car is that it can take you a bunch of places that the bus does not go and it is quicker for some trips that would require transferring between busses. Using this analogy, programs like SPSS are busses, easy to use for the standard things, but very frustrating if you want to do something that is not already preprogrammed. R is a 4-wheel drive SUV (though environmentally friendly) with a bike on the back, a kayak on top, good walking and running shoes in the passenger seat, and mountain climbing and spelunking gear in the back. R can take you anywhere you want to go if you take time to learn how to use the equipment, but that is going to take longer than learning where the bus stops are in SPSS. – Greg Snow
Greg compares R to SPSS, but he assumes that you use the full powers of R; in other words, that you learn how to program in R. If you only use functions that preexist in R, you are using R like SPSS: it is a bus that can only take you to certain places. This flexibility matters to data scientists. The exact details of a method or simulation will change from problem to problem. If you cannot build a method tailored to your situation, you may find yourself tempted to make unrealistic assumptions just so you can use an ill-suited method that already exists. This course will help you make the leap from bus to car.
Acknowledgments
Many of the examples in this course are inspired by …
- R for Data Science by Hadley Wickham & Garrett Grolemund
- Hands-On Programming with R by Garret Grolemund